
Public Comps - Dec '19 Efficiency & Elastic
Efficiency Matters for Public SaaS & Elastic Earnings Teardown
👋From Jon and Howard 👋
Thank you again for being customers or supporters of Public Comps 🙏🏼
Key Takeaways
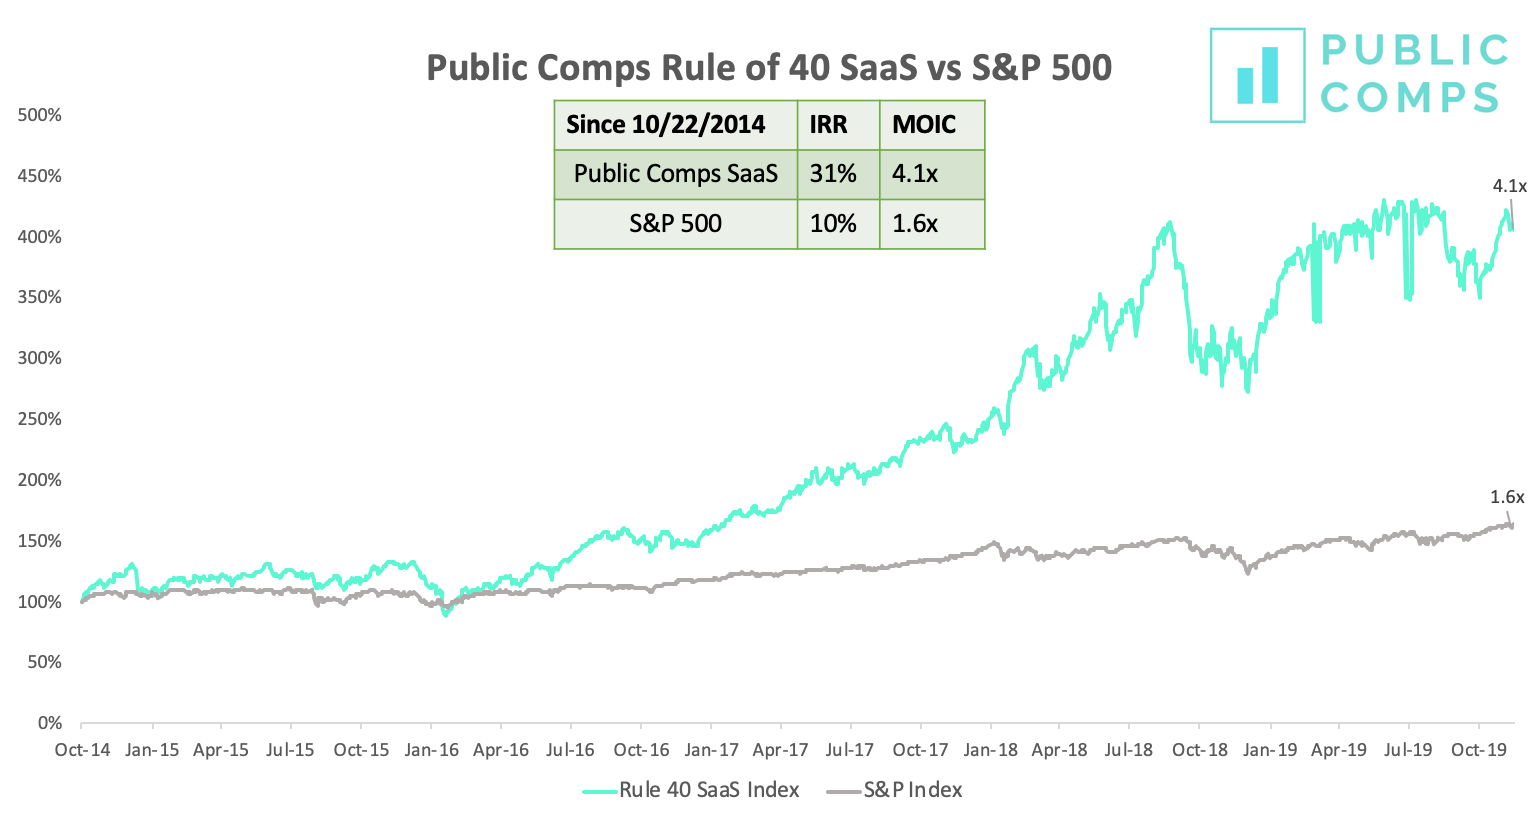
1️⃣Public SaaS Index: In the last 5 years, if you invested in Public Comp Rule of 40 SaaS Index that includes companies with an efficiency of >40% (Free Cash Flow % + Revenue Growth %), you'd be up 4.1x with a ~31% IRR.
2️⃣Valuation vs Efficiency & Growth Rate: Public market investors seem to value growth more than profitability but do reward the combination. For a 10% increase in efficiency, Public SaaS companies on average see an increase of their EV/2020 Revenue multiple by 1.3x. For a 10% increase in growth rate (e.g 30% to 40% YoY growth), Public SaaS companies see an average increase of their revenue multiple by 1.4x.
🚨 Product Update: See a live scatterplot of Public SaaS companies🚨
Thanks to Chris at Bain Capital Ventures & Eoghan at Intercom for the product suggestion 🙏🏼
3️⃣Elastic Earnings: Elastic went down 12% after releasing its earnings press release for posting a -$50m operating loss (-50% operating margin) for the Q2 2020 quarter. We believe the market doesn't focus enough on free cash flow which accounts for a large amount of cash enterprise software companies collect upfront & we believe FCF is a better indicator of the profitability for SaaS companies. For Elastic, FCF was -$1.4m or -1% FCF margin for the quarter -- far lower than the -50% operating margin analyst were worried about.
Elastic is the 7th fastest growing SaaS company, has a high net dollar retention of >130% because of Elastic's wide offerings beyond app or site search, isn't burning a lot of capital, has a 20-month payback period and has the 2nd lowest valuation of at 8.7x EV/2020 Revenue or 7.3x EV/NTM ARRR.
Public SaaS Index - December 15th, 2019
Our close friend Chris Zeoli suggested creating a SaaS Index of companies with >40% efficiency, high net dollar retention and high sales efficiency. Howard & I decided to backtest and see what returns would've been like if you invested in JUST companies that followed the rule of 40 (revenue growth % YoY + free cash flow % >= 40%) -- we plan on doing some more extensive analysis in the coming weeks on including all 3 of those factors.
👉Takeaway: In the last 5 years, if you had invested in Public Comps Rule of 40 SaaS Index, you'd be up 4.1x MOIC with a ~31% IRR and perform better than the S&P (10% IRR, 1.6x MOIC) and a SaaS index (27% IRR, 3.3x MOIC). Public companies that grew revenue quickly but did so without high burn or even profitably seemed to be rewarded.
🙏🏼Auren Hoffman who reminded us to add LiveRamp to our SaaS Index
EV/2020 Revenue vs Efficiency and Growth Rate
A couple of customers asked to see how revenue multiples trended according to revenue growth rate or efficiency. Here's the live scatter plot analysis of Public SaaS companies.
👀 https://www.loom.com/share/230ae633001443f7b5f991467486e121
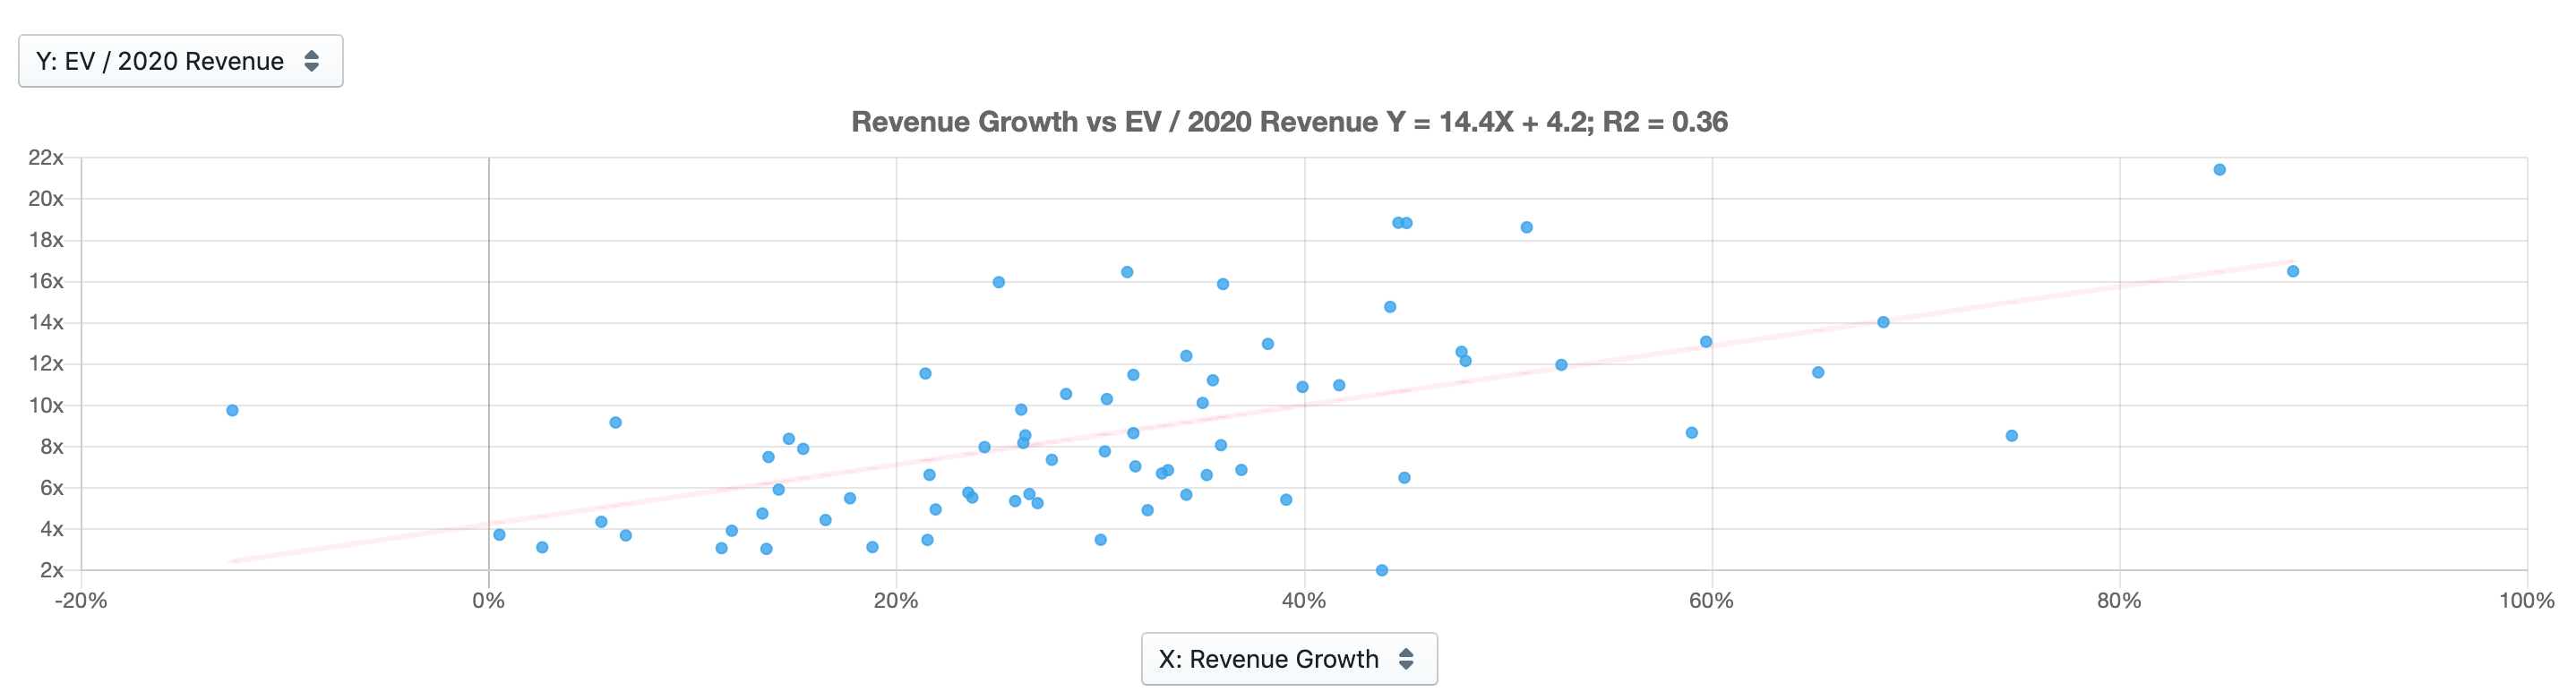
👉Takeaway: Public market investors seem to value growth more than profitability but do reward the combination. For a 10% increase in efficiency, Public SaaS companies on average see an increase of their EV/2020 Revenue multiple by 1.3x. For a 10% increase in growth rate (e.g 30% to 40% YoY growth), Public SaaS companies see an average increase of their revenue multiple by 1.4x.
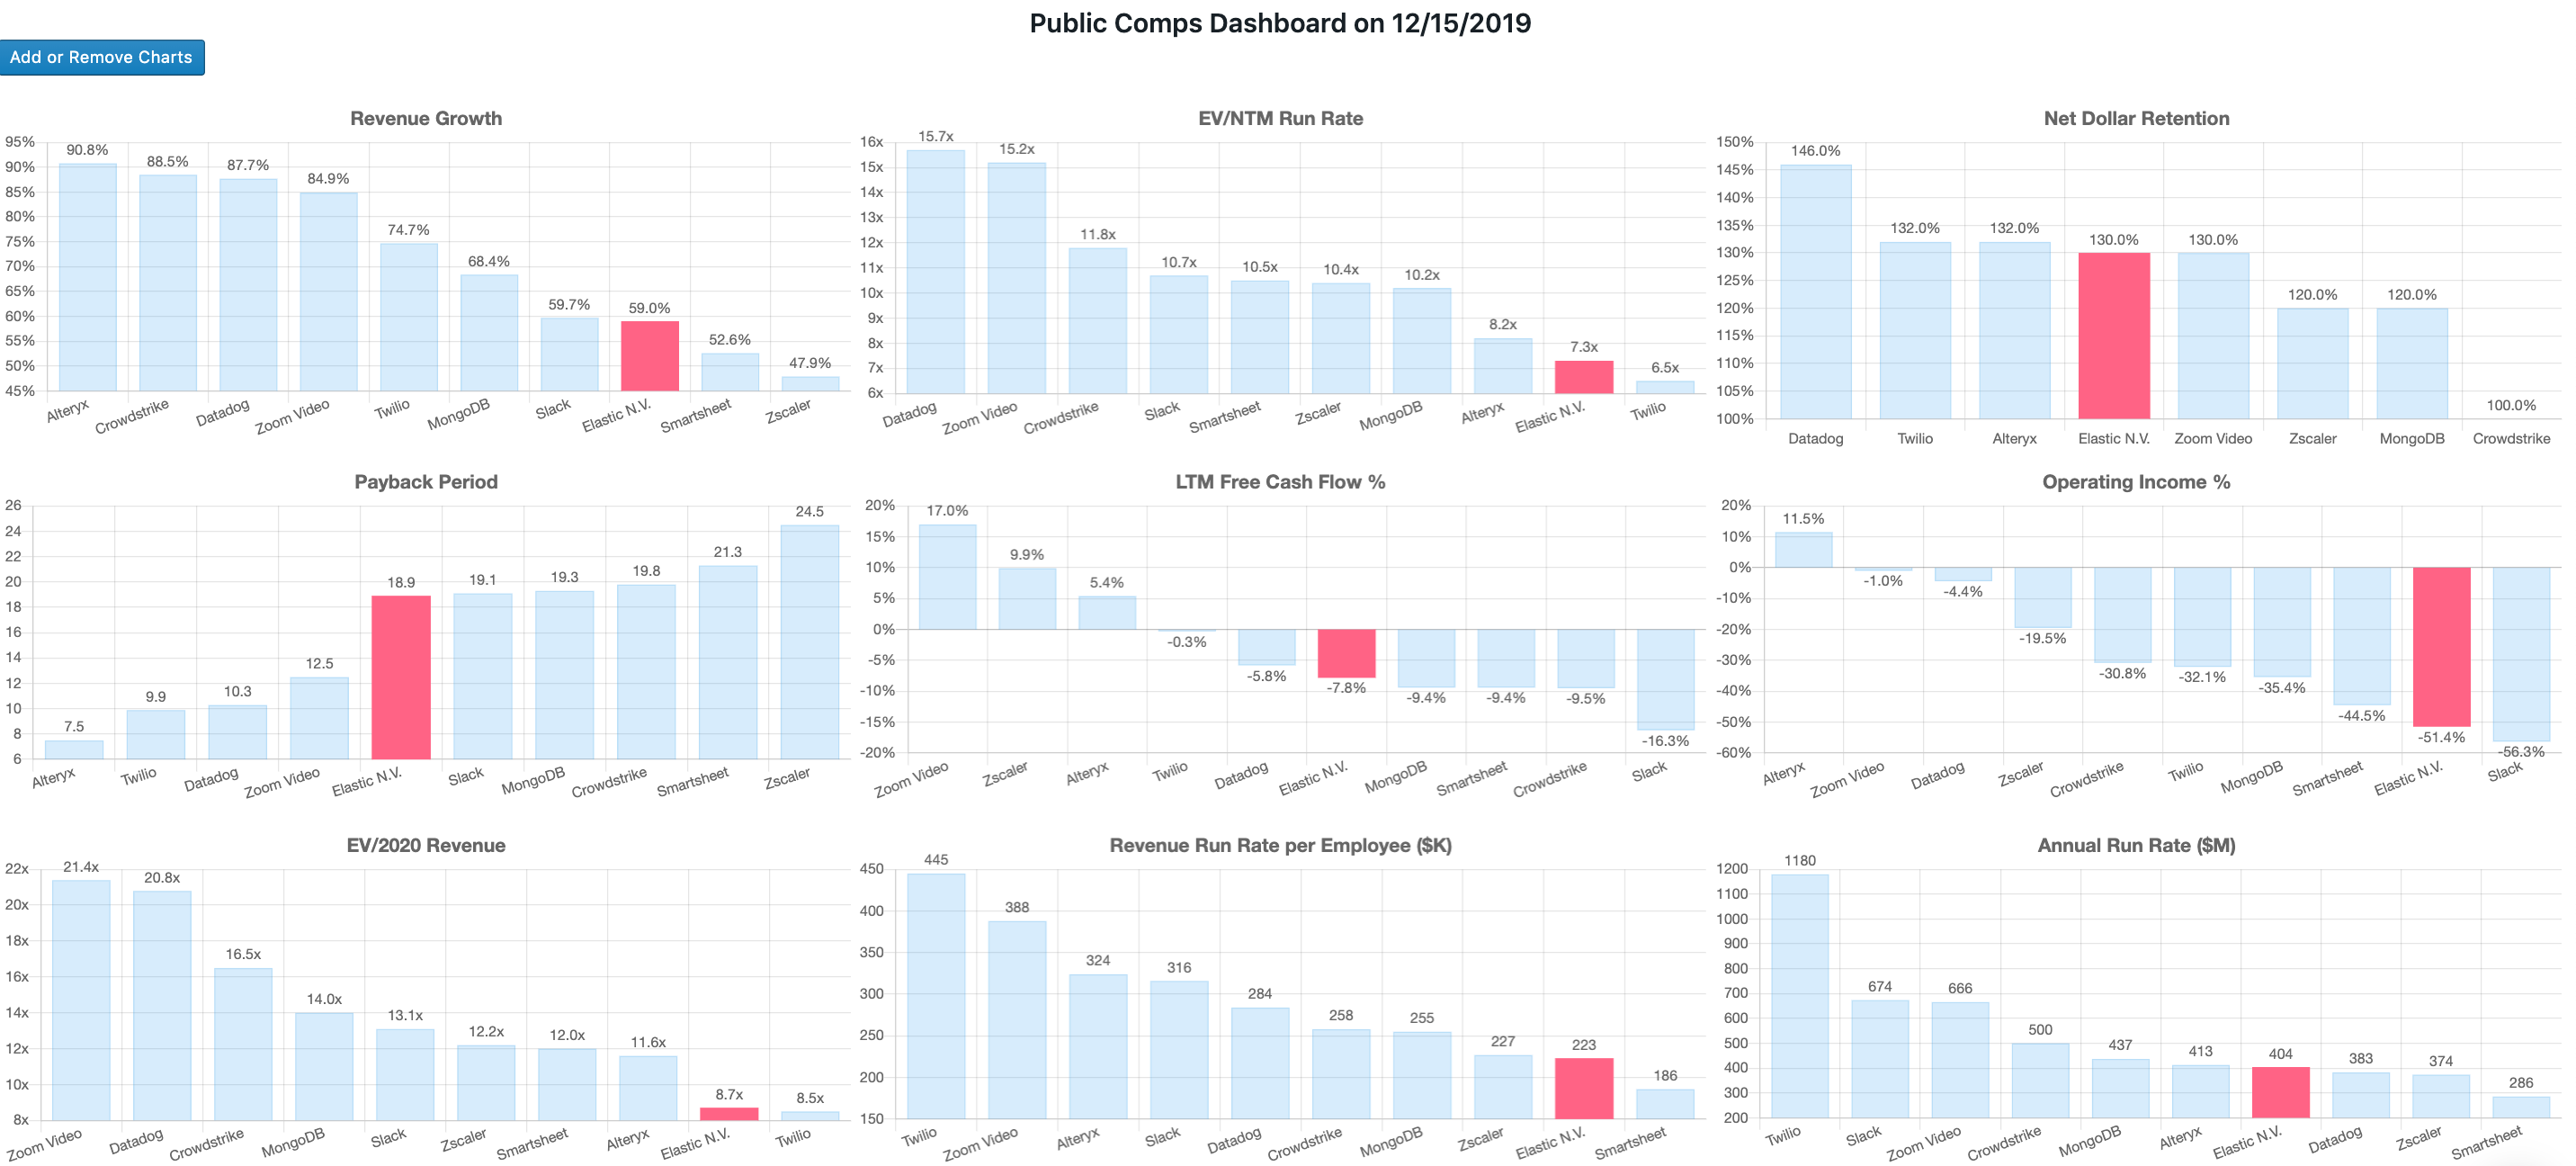
Elastic Dec'19 Earnings Teardown
Elastic is a high growth SaaS company with $366m ARR and 66% ARR YoY growth. Yet the business fell 12% in share price after its earnings reported.
Here's why Elastic is a 💪 business and why the market reacted so negatively.
Description: Elastic NV is an open-source search company that powers search for companies like Uber (matching drivers & riders), Tinder (matching algorithm + DevOps/Security), Adobe (searching for fonts and photos), and Instacart (search & recommendations for groceries). The company also provides logging, metrics, APM, and business analytics solutions and is the commercial entity behind the Elastic Stack which basically allows developers to ingest and store data (e.g user, log, metrics data) and to search, analyze or visualize data quickly.
Competition:
⚔️Search: Amazon Web Services Elastic Search Service (which uses Elastic's open source project but doesn't get the benefits of Elastic NV's proprietary feature set), Apache Solr (open source), Algolia ($40m revenue '18 and raised $110m on Oct '19)
⚔️Logging & Security Analytics: Splunk, Microfocus ArcSight SIEM, Sumo Logic, Datadog
⚔️Metrics & APM: New Relic, AppDynamics, Datadog
Strengths
👏7th Fastest-Growing Public SaaS at 66% YoY ARR
👏High Net Dollar Retention at >130% — multiple offerings allows customers to use for app and site search + security + business analytics
🤨2nd lowest SaaS valuation (7.3x EV/NTM Revenue Run Rate & 8.7x EV/2020 Revenue)
Weaknesses
👎8th highest payback period at 20 months-- management investing heavily into S&M in last 12 months (>$20m+)
👎2nd lowest operating income % at -51% but FCF is -1% for the most recent quarter (-10% FCF over last-twelve-month) with $300m on balance sheet
10/2019 Earnings Takeaway & Market's Obsession with Operating Loss?
👉Elastic went down 12% after releasing its earnings press release for posting a -$50m operating loss for the Q2 2020 quarter or $0.64 loss per share. Analysts estimated $0.34 loss per share so the $0.64 loss per share was a shock. However, free cash flow for the quarter was -$1.4m or -1% FCF margin -- far lower than the -50% operating margin that seems troubling on face value
We don't believe the market focuses enough on free cash flow which accounts for a large amount of cash enterprise software companies collect upfront. We personally believe free cash flow is a better indicator of the profitability of SaaS companies as GAAP revenue doesn't account for large upfront contracts that companies like Elastic get from buyers (all the unrecognized revenue gets buried under deferred revenue). Cash is the lifeblood of a company and a better indicator of "runway": Elastic has over $300m in the bank and burning -$1.4m a quarter suggests the business isn't going to run out of cash anytime soon.
👉Zoom is another example of the market potentially not focusing enough on free cash flow. The business reported 85% YoY growth rate in 2019Q3 down considerably from 120% YoY in 2018Q3. Understandably analysts and investors were worried. GAAP Operating income was -$1.1 with -1% operating margins. However, on the free cash flow side, the 2019Q3 FCF margins are 33% up from -7% FCF % in 2018Q3. Putting that into context, Atlassian has ~30% FCF margins but now only grows about 36% YoY. ZM's stock price dropped nearly 11% post the earnings despite Zoom having the highest efficiency of 118% (using current FCF % instead of LTM FCF %) among all public software companies
Bottom Line: Analyst and the market seem to be focused on operating income/loss which drives earnings per share when perhaps they should be focused on free cash per share which is a better representation of the enterprise software model.